Splunking Plastic SCM
Take a look at the following screenshot. It’s the dashboard of my
Splunk installation and is all about having beautiful real-time information about my local Plastic SCM server.
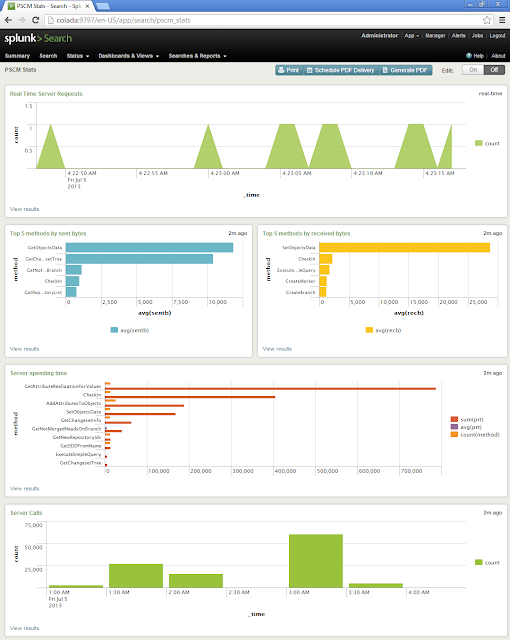 |
| Plastic SCM Dashboard (Click to enlarge) |
I have the following charts, but more can be created:
- Number of requests shown in real time.
- Top 5 requests sending more data.
- Top 5 requests receiving more data.
- Top ten calls hoarding machine time.
- Historic info of the total number of server requests.
Splunk server installation
Grab the Splunk installer from the Splunk webpage (
http://www.splunk.com/download).
Splunk is free for a low traffic rate per month. I’ve chosen Debian as my server machine, these are the steps for installing Splunk in Linux (
http://docs.splunk.com/Documentation/Splunk/5.0.3/Installation/InstallonLinux). First, install the package; you should see something like the following at the end of the process:
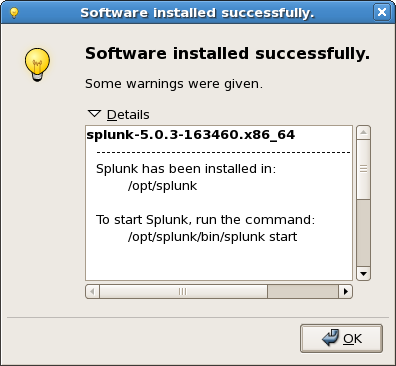 |
| Splunk deployed (Click to enlarge) |
When the installation is over, we are ready to start browsing the Splunk portal!
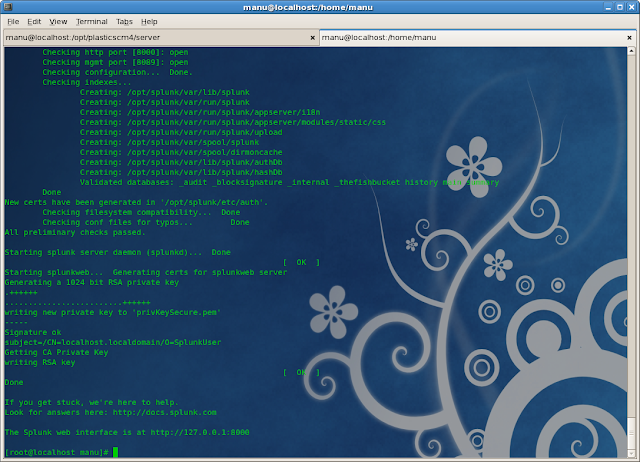 |
| Starting the Splunk daemon (Click to enlarge) |
The server, by default, is up and running in the 8000 port, ready to start listening for remote data, so let’s start sending some from a Plastic SCM server.
Splunk forwarder installation and set-up
We’ll need a
Splunk forwarder in order to send the Plastic SCM log to the central Splunk server. The forwarder is in charge of monitoring the new data written in the “ChannelCall.log.txt” file and sending it to Splunk.
Installing the Splunk forwarder in Linux is as easy as installing the Splunk server; the forwarder is actually a subset of the server! The forwarder can be installed on the same Splunk server machine or in a different one; we are going to install it where the Plastic SCM is installed. You will need to edit small configuration files in order to forward the Plastic SCM log data to the Splunk server.
Inputs.conf
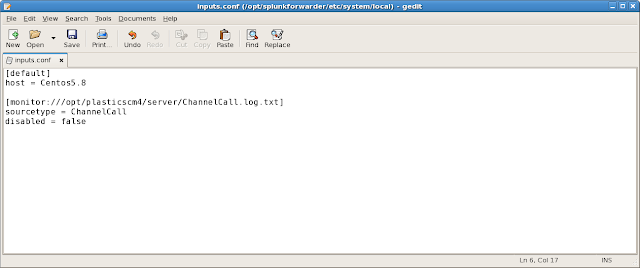
The “/opt/splunkforwarder/etc/system/local/inputs.conf” file contains the name of the forwarding server (will be displayed in the Splunk Server console) and the file that the Splunk forwarding server is going to be monitoring and sending to the Splunk central site.
+-+gedit.png) |
| Inputs.conf file (Click to enlarge) |
Notice that the “sourcetype” is “ChannelCall”, we will use this name in the Splunk central site to extract and identify all the log fields contained in the “ChannelCall.log.txt” file. All the information indexed by Splunk is retrieved from the “ChannelCall.log.txt” file, this log is generated by the “loader.log.conf” file. You will need to use
this one to improve the format to be parsed by Splunk. I have just changed the “Conversion pattern” of the “RollingChannelFileAppender”, this is how it should look like:
<conversionPattern value="%date %-5level %logger - %message%newline" />
If you are not sure about editing the file on your own you can just download the one above and replace the one you have in the Plastic SCM server directory. Once the “loader.log.conf” is changed and the “inputs.conf” file is configured we are ready to start the Splunk forwarder. The forwarder is started as the regular Splunk server.
>sudo /forwarderPath/bin/splunk start
Receiving data
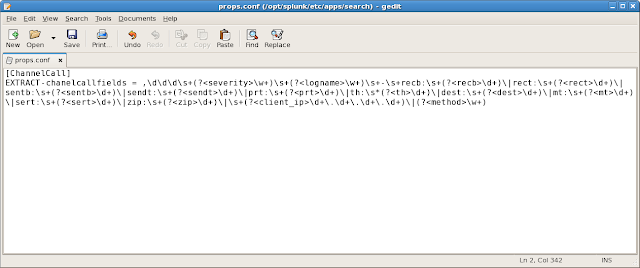
As we said before the data type we are going to use is called “ChannelCall”, let’s define it in the Splunk server. Create or edit the “
props.conf” file you will find in the “/opt/splunk/etc/apps/search” directory.
+-+gedit.png) |
| props.conf file (Click to enlarge) |
Nice regex, right? Here you have it in plain text:
[ChannelCall]
EXTRACT-chanelcallfields = ,\d\d\d\s+(?<severity>\w+)\s+(?<logname>\w+)\s+-\s+recb:\s+(?<recb>\d+)\|rect:\s+(?<rect>\d+)\|sentb:\s+(?<sentb>\d+)\|sendt:\s+(?<sendt>\d+)\|prt:\s+(?<prt>\d+)\|th:\s*(?<th>\d+)\|dest:\s+(?<dest>\d+)\|mt:\s+(?<mt>\d+)\|sert:\s+(?<sert>\d+)\|zip:\s+(?<zip>\d+)\|\s+(?<client_ip>\d+\.\d+\.\d+\.\d+)\|(?<method>\w+)
We have now to enable the reception of the “ChannelCall” data for the Splunk server, open the manager view, click on “
Forwarding and receiving”, and then as we need to receive remote info, we have to click on “
Receive data”
 |
| Splunk manager view (Click to enlarge) |
The view is empty by default, so we need to configure the receiving by adding a new
listening port. The default port for receiving information from the forwarders is the “9997”.
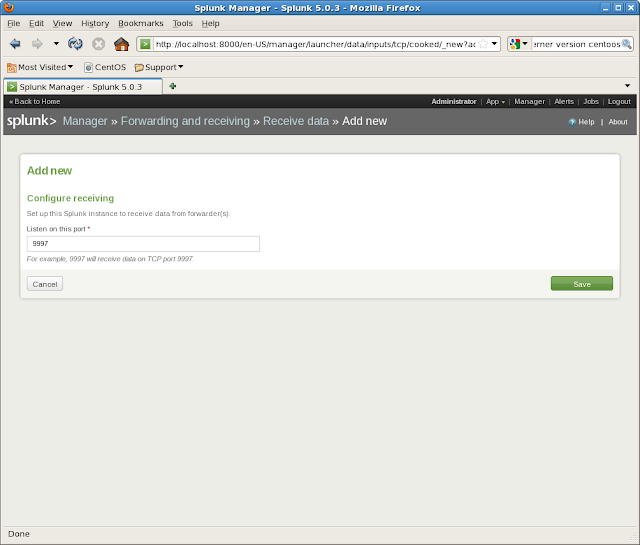 |
| Adding new re-sending info (Click to enlarge) |
Once the configuration is saved, the Splunk server will immediately start listening for the incoming data. You can review it inside the “Search” application.
 |
| Splunk server receiving data from Plastic SCM (Click to enlarge) |
In the image above we can review that 3 events are now parsed by the Splunk server and the type is
correctly identified as “ChannelCall”.
Creating queries and views
All the views can be created through the “Search” application view. You can open it by clicking on “
App” and then “
Search”.
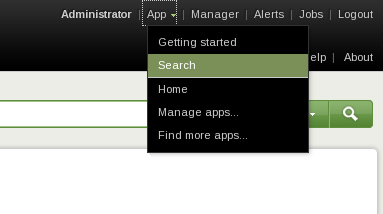 |
| Opening the Search application (Click to enlarge) |
The “search” view allows us to create
queries from our indexed “ChannelCall” data. The output of the queries can be saved as new
dynamic views. All the search results can be presented in a table view or in a graphical mode. Both views are great, but if you want to build a dashboard later with lots of data, then it’s better to use the graphical one. The graphical mode is easier to handle and review. Later, if something needs to be debugged, you can do it by using the table representation.
Let’s review a few queries now.
1. Server calls (both Real-time and historic)
The search for this view is: “sourcetype="ChannelCall" | timechart count” and it looks like:
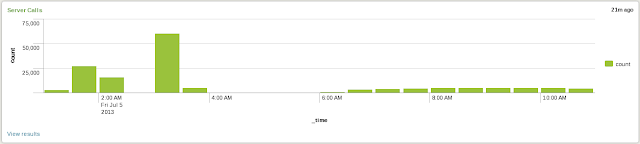 |
| Plastic SCM server calls (Click to enlarge) |
2. Top 5 methods by sent bytes
The search for this view is: “sourcetype="ChannelCall" | stats avg(sentb) by method | sort 5 - avg(sentb)” and it looks like:
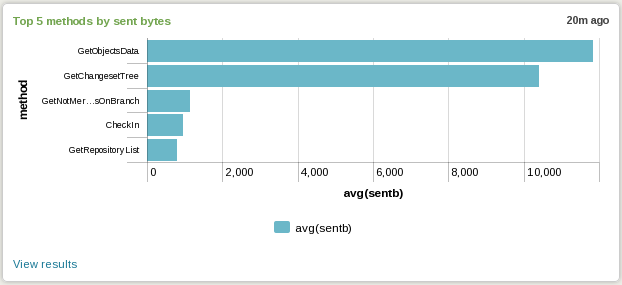 |
| Plastic SCM server top 5 methods sending data (Click to enlarge) |
3. Top 5 methods by received bytes
The search for this view is: “sourcetype="ChannelCall" | stats avg(recb) by method | sort 5 - avg(recb)” and it looks like:
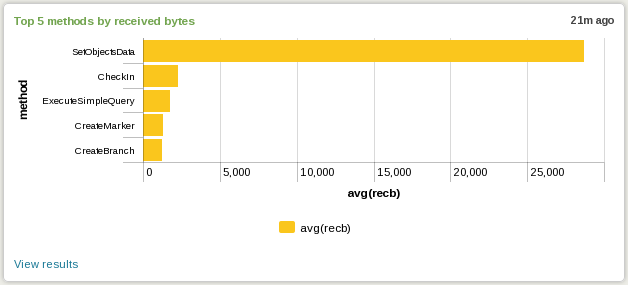 |
| Plastic SCM server top 5 methods receiving data (Click to enlarge) |
|
4. Where is the server spending the time?
The search for this view is: “sourcetype="ChannelCall" | stats sum(prt), avg(prt), count(method) by method | sort 10 -sum(prt)” and it looks like:
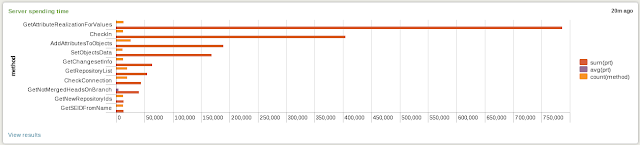 |
| Plastic SCM server spending time (Click to enlarge) |
|
Creating a Plastic SCM Dashboard
All the views shown in the previous point, and all the created by your own, can be included in a nice Splunk
Dashboard. A Plastic SCM dashboard allows you to have a
fast overview of the Plastic SCM server status.
You will need click in the “Create” green button inside the Splunk “Search” view. Then select “Dashboard panel”. Give it a name and click “Next”, If this is your first time you will need to create a new Dashboard panel, if no, you can select an existing one and place the search result there.
The views inside a Splunk dashboard can be moved and placed around the dashboard area, the
drag and drop action will nicely do the bulk of the work.
Happy Splunking and share your dashboards!
Manuel Lucio
I'm in charge of the Customer Support area.
I deal with complex setups, policies and working methodologies on a daily basis.
Prior to taking full responsibility of support, I worked as software engineer. I have been in charge of load testing for quite some time, so if you want to know how well Plastic compares to SVN or P4 under a really heavy load, I'm your guy.
I like to play with Arduino GPS devices, mountain biking and playing tennis.
You can find me hooked to my iPhone, skate-boarding or learning Korean... and also here
@mrcatacroquer.


+-+gedit.png)
+-+gedit.png)


0 comentarios: